 +91 9893014167
 1 (888) 316-3286
 +44 20 3807 2189
 Chat on WhatsApp


A Home Décor Store Made 75% More Revenue From The Same Number Of Visitors.

+75.9%more revenueBy the end of month three
+39%more visitors buyingOnline shop conversion rate
Samenumber of visitorsThe growth came from the shop itself
Every Result, At A Glance
| Result | What It Means |
|---|---|
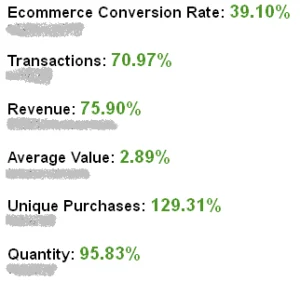
| +75.9% | more revenue from the website by the end of month three. |
| Same traffic | Visitor numbers stayed almost constant, so the gain came from the shop itself. |
| +39.1% | improvement in the ecommerce conversion rate, meaning more visitors became buyers. |
| Bigger orders | The average order value (what each customer spends) improved. |
| More purchases | Unique purchases and the number of products bought also went up. |
Real Snapshots From The Campaign
Figures from the shop’s own Google Analytics, taken during the campaign.
Google AnalyticsEcommerce, end of month three against before
Work Done, Over Three Months
| # | Activity | What exactly | When |
|---|---|---|---|
| Research | |||
| 1 | Visitor data | Two years of Google Analytics data analysed | At the start |
| 2 | Findings | Certified analysts turned the data into clear findings | At the start |
| 3 | Barriers | What stopped people from buying | At the start |
| 4 | Customer survey | Existing customers asked what made checkout hard | At the start |
| Changes And Tests | |||
| 5 | Shopping experience | Survey answers used to improve the shop | Ongoing |
| 6 | New ideas | Wording, pictures and navigation ideas with the client | Ongoing |
| 7 | A/B tests | Side-by-side tests to find the weak parts | Ongoing |
| 8 | Better versions | Weak parts swapped for the versions that sold more | Ongoing |
How we measured
- Numbers from the client’s own Google Analytics at the time. This case study was first published in January 2017.

