Last updated: 19 September 2026
Organic sessions are down by a third since spring. Nobody deployed anything. The sales team noticed before the marketing team did.
Guessing wrong here is costly in a particular way: every wrong guess produces work. Rewrite the content when the cause was a broken tag, and you have spent a quarter fixing something that was never broken.
Start by establishing whether traffic actually fell or only appears to have fallen, because a tracking failure and a ranking loss look identical in a sessions graph. Then match the shape of the curve to a cause, confirm it in Search Console, and only then decide what to change. Google publishes both the cause categories and the exact dates of its ranking updates, so most of this is checkable rather than arguable.
Key facts
- Google’s official guidance on debugging Search traffic drops names six cause categories: algorithmic updates, technical issues, security threats, spam violations, seasonality and changing interests, and site migrations.
- Google matches drop shapes to causes, treating a large sudden drop as a likely algorithmic update, security issue or spam violation, and a gradual decline as a technical problem or shifting interest.
- Google distinguishes a small position change, such as rank 2 to rank 4, from a large one such as rank 4 to rank 29, and advises against radical changes where a page is already performing well.
- Google’s Search Status Dashboard records the exact start and finish of every ranking update, so a drop can be checked against a published window.
- Recent core updates took between 11.9 and 18.1 days to roll out, based on dashboard records from March 2025 to May 2026.
- Google ran three core updates in 2025 and two in the first eight months of 2026, alongside separate spam updates.
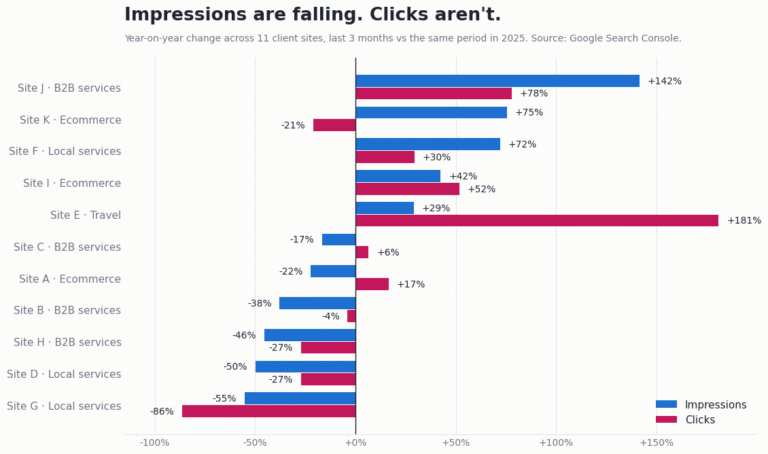
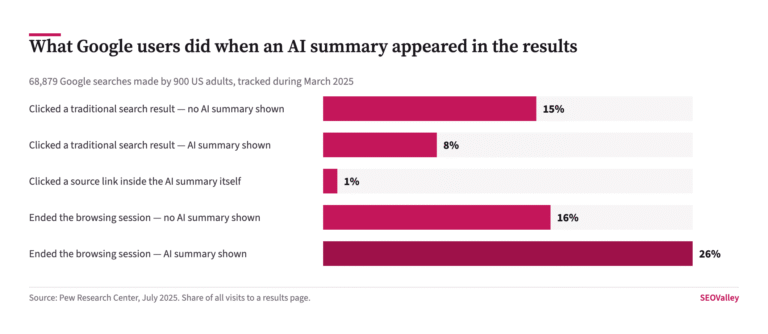
- Where an AI Overview appears, Ahrefs measured a 58% lower average click-through rate for the top-ranking page across 300,000 keywords, so impressions can hold while clicks fall without any ranking change.

What follows is the order to work in: rule out measurement, read the shape, check the dated causes, then narrow to the pages and queries that actually moved. Each step names the report and the setting.
Did traffic actually fall, or did tracking break?
Answer this before anything else, because it is the cheapest check and the most commonly skipped one. Analytics can fail silently; Search Console cannot fail in the same way.
What it looks like: sessions drop almost to zero on a single day, or fall by a suspiciously round proportion, and no other metric moves with them.
Why it matters: Google Analytics is client-side and consent-dependent. A tag removed during a deploy, a consent banner change, or a container republished without the right trigger all reduce recorded sessions without touching a single ranking.
The check: open Search Console’s Performance report and compare clicks over the same period. Search Console counts clicks server-side, before your tag fires and regardless of consent choices. If Search Console clicks are steady while analytics sessions collapsed, the fault is in your measurement, not in search. If both fell together, the loss is real.
This one check re-sorts most emergencies. A GA4 property that is misconfigured produces a more alarming graph than most algorithmic losses, and it is fixed in an afternoon rather than a quarter.
What does the shape of the curve tell you?
Most of the diagnosis, before you open a single report. Google’s own guidance pairs drop patterns with likely causes.
Key data: a large sudden drop points to an algorithmic update, a site-wide security issue or a spam violation. A gradual decline points to technical problems or changing interest. A repeating annual pattern is seasonality. An unexplained anomaly may be a reporting glitch on Google’s side.
The check: in Search Console, set the date range to Last 16 months. Sixteen months is deliberate — it is the longest range available and the only one that lets you see the same month last year. If the dip repeats at the same point in both years, you are looking at your market, not your site.
Was there a Google update on that date?
This is answerable exactly, and most teams argue about it instead of looking it up. Google records every ranking update with a start and end time.

Key data: the five most recent core updates ran between 11.9 and 18.1 days. The March 2024 core update, unusually, took 45 days.
Why it matters: a rollout lasting a fortnight means rankings move throughout it. Judging your position on day three of an update, panicking, and shipping changes on day four leaves you unable to attribute anything that happens on day fifteen.
The check: open the Google Search Status Dashboard ranking history and compare the update window against the first day of your decline. If your drop starts inside a published window, treat it as algorithmic until proven otherwise, and wait for the rollout to finish before changing anything.
Is it a manual action or a security problem?
Rule these out early because they are binary, quick to check, and change the entire response if present.
The check: in Search Console, open Security & Manual Actions. The Manual Actions report tells you whether a human reviewer has applied a penalty, and the Security Issues report flags malware and phishing. Both report “no issues detected” when clean, which is a definite answer rather than an absence of information.
Why it matters: a manual action requires a reconsideration request after fixing the violation, which is a different process with a different timeline. There is no point auditing content while a penalty is live.
Did something break technically?
Technical causes usually produce a gradual decline rather than a cliff, because pages drop out of the index at the rate Google recrawls them.
The check: open Indexing, then Pages. Compare the count of indexed pages against three months ago and read the reasons given for exclusions. A rise in “Crawled – currently not indexed”, “Blocked by robots.txt” or “Excluded by noindex tag” dates the problem. Then open Settings, then Crawl stats, and look for a spike in 5xx responses or a collapse in crawl requests.
The classic cause is a staging robots.txt or a noindex directive shipped to production. It is worth checking even when someone insists nothing was deployed, because a CDN or plugin update is a deployment whether or not anyone logged it.
Did rankings fall, or did clicks fall while rankings held?
These require opposite responses, and the sessions graph cannot tell them apart.
Key data: Ahrefs measured a 58% lower average click-through rate at position one when an AI Overview is present, across 300,000 keywords. A page can hold its position and lose most of its traffic.
The check: in the Performance report, switch the date range to Compare and put the last three months against the same period a year ago. Add Average position alongside Clicks and Impressions. If impressions hold and average position is stable while clicks fall, nothing has been demoted — the result page changed around you, which is a different problem with a different set of causes.
Did you change the site yourself?
The most under-investigated cause is your own release history, because the people diagnosing the drop are rarely the people who shipped the change.
What it looks like: a decline that begins on a date nobody can account for, on a site where “nothing was deployed”.
Why it matters: a template change that removes internal links, a cookie banner that now blocks rendering, a plugin update that alters canonical tags, or a redesign that drops body copy will all cost traffic without anyone filing it as an SEO change.
The check: ask for the deployment log for the fortnight before the drop began, and put those dates on the same chart as the clicks. Then compare a current page against its version in the Wayback Machine from before the decline — word count, internal links, headings and title tag. Seeing the two side by side settles arguments that would otherwise run for weeks.
Which pages and queries actually moved?
Narrowing is what turns a diagnosis into a task list. A site-wide average conceals the fact that the loss is usually concentrated.
The check: in the same Compare view, open the Pages tab and sort by click difference. Export it. In most declines, a small number of URLs account for the majority of lost clicks. Then open the Queries tab for those URLs specifically, so you learn which intent was lost rather than which page was lost.
Why it matters: a drop spread evenly across every URL suggests something site-wide — a template change, a speed regression, a domain-level signal. A drop concentrated in twenty URLs suggests those pages lost a specific competition, and the fix is on those pages.
Could it just be demand?
Frequently, and this is the answer nobody wants because it cannot be fixed with work on the site.
The check: take your three main head terms to Google Trends and set the range to five years. If the curve for the category fell at the same time as your traffic, your share may be intact while the market shrank. Confirm it in Search Console by checking whether impressions fell alongside clicks — falling impressions on stable positions means fewer people are searching.
Say this plainly to stakeholders when it is true. Reporting a market contraction as an SEO failure leads to a budget decision that makes the position worse.
How long should you wait before acting?
Long enough to be sure the movement is real, which for an algorithmic cause means waiting for the rollout to complete and then watching for a further week. Two weeks of patience is cheaper than a quarter of misattributed work.
The exception is a technical fault or a manual action. Those are binary, confirmed rather than inferred, and should be fixed the day they are found. The waiting rule applies to ranking movements you are trying to explain, not to faults you have already identified.
Which report answers which question
| Question | Where to look | What a clean result looks like |
|---|---|---|
| Did tracking break? | Search Console Performance vs GA4 sessions | Both trends move together, even if the totals differ |
| Was there an update? | Google Search Status Dashboard | No published window overlaps your first day of decline |
| Is there a penalty? | Security & Manual Actions | Reports no issues detected |
| Did indexation fall? | Indexing, Pages report | Indexed count stable against three months ago |
| Did the result page change? | Performance, Compare mode with Average position | Clicks, impressions and position all moved together |
| Is demand falling? | Google Trends, five-year range | Category curve flat while your impressions fell |
Symptom, cause and how to confirm it
| Symptom | Likely cause | How to confirm |
|---|---|---|
| Sessions collapse, Search Console clicks steady | Analytics or consent tracking failure | Compare GA4 sessions against Search Console clicks for the same dates |
| Sharp cliff on one date, flat afterwards | Algorithmic update, manual action or security issue | Search Status Dashboard for the date; Security & Manual Actions in Search Console |
| Steady slide across several months | Indexation decay or shifting interest | Indexing, Pages report — compare indexed count and exclusion reasons over 3 months |
| Same dip as this time last year | Seasonality | Search Console, Last 16 months; confirm the category in Google Trends |
| Impressions and position hold, clicks fall | Result page changed — AI Overview or new features | Performance report in Compare mode with Average position enabled |
| Loss concentrated in a handful of URLs | Those pages lost a specific competition | Pages tab sorted by click difference, then Queries for those URLs |
What to do once you know which one it is
Work in the order above and the expensive mistakes disappear. Measurement first, because a broken tag is the most common cause and the cheapest to rule out. Then the shape of the curve, then the dated causes Google publishes, then the pages that actually moved. Google names six cause categories and records the timing of every ranking update, which means most of this argument has a published answer.
The single next action is to put Search Console clicks and analytics sessions on the same chart for the last sixteen months. If they diverge, stop looking at rankings and go and fix the tag.
What not to do: do not rewrite content during an active core update rollout, because you will not be able to attribute the recovery or the further decline. Do not make radical changes to pages that are only down a place or two — Google explicitly advises against it. And do not present a market-wide decline as a site problem. Where the cause is genuinely algorithmic, recovery takes months rather than weeks, and the work is a structured audit of the pages that lost, not a sitewide rewrite. If the loss turns out to sit in older articles that used to perform, refurbishing what already has authority usually returns more than new publishing, and our blog marketing team plans that work from the exported Pages table rather than from a keyword tool.
About the author
Shabir MS leads SEOValley Solutions and has worked in search since 2005. He has run traffic-drop investigations through every core update since Panda, and the first question he asks a new client is still whether the tag is firing. Read more from Shabir MS.
Frequently asked questions
What is the first thing to check when organic traffic drops?
Whether tracking broke. Compare Search Console clicks against analytics sessions for the same dates. Search Console counts server-side, so it is unaffected by tags and consent banners.
What causes organic traffic to drop?
Google names six categories: algorithmic updates, technical issues, security threats, spam violations, seasonality and changing interests, and site migrations.
How do I know if a Google update caused my drop?
Check the Google Search Status Dashboard, which records the exact start and end of every ranking update, and compare that window against the first day of your decline.
How long do Google core updates take to roll out?
Recent ones ran between 11.9 and 18.1 days. The March 2024 core update was an outlier at 45 days. Rankings move throughout the rollout.
Should I make changes during a core update rollout?
No. Rankings fluctuate for roughly a fortnight, so changes made mid-rollout cannot be attributed afterwards. Wait for the dashboard to show the update finished.
How do I check for a Google penalty?
Open Security & Manual Actions in Search Console. The Manual Actions report shows whether a human reviewer applied a penalty; a clean account reports no issues detected.
Why did my clicks fall while my rankings stayed the same?
The result page changed around you. Ahrefs measured a 58% lower click-through rate at position one when an AI Overview is present, across 300,000 keywords.
How far back can Search Console data go?
Sixteen months. That range matters because it is the only one that lets you compare the same month against last year and identify seasonality.
How do I find which pages lost the traffic?
Use the Performance report in Compare mode, open the Pages tab and sort by click difference. Losses are usually concentrated in a small number of URLs.
Could a traffic drop just be seasonal?
Yes. Expand Search Console to sixteen months and check whether the same dip occurred last year, then confirm the category trend in Google Trends.
What technical problems cause gradual declines?
Indexation loss. Check the Indexing, Pages report for rises in crawled but not indexed, blocked by robots.txt, or excluded by noindex, and check Crawl stats for 5xx spikes.
How long does recovery from a core update take?
Months rather than weeks. Google advises assessing whether the content is helpful, reliable and people-first, and warns that improvements may not be reflected until a later update.