+91 9893014167
  1 (888) 316-3286
 +44 20 3807 2189
 Chat on WhatsApp
Last updated: 19 September 2026
The Core Web Vitals report in Search Console has been amber for eight months. Two developers have spent a sprint on it, the numbers moved slightly, and rankings did not.
The temptation now is to conclude the whole thing is theatre and stop. That would be the wrong lesson from the right observation.
Core Web Vitals are a real part of how Google evaluates page experience, and Google says plainly there is no single page experience signal and that a good Core Web Vitals report does not guarantee ranking. Passing is worth doing because slow pages lose users; expecting a ranking jump from it is what turns the work into theatre.
Key facts
- The three Core Web Vitals and their good thresholds are Largest Contentful Paint at 2.5 seconds or faster, Interaction to Next Paint at 200 milliseconds or faster, and Cumulative Layout Shift at 0.1 or lower, per Google’s web.dev Web Vitals documentation.
- Those thresholds are assessed at the 75th percentile of page loads, segmented separately for mobile and desktop.
- Interaction to Next Paint became a stable Core Web Vital in 2024, replacing First Input Delay.
- Google states on Search Central that “there is no single signal” for page experience, and that its core ranking systems look at a variety of signals.
- Google also states that good results in the Core Web Vitals report “doesn’t guarantee that your pages will rank at the top of Google Search results”.
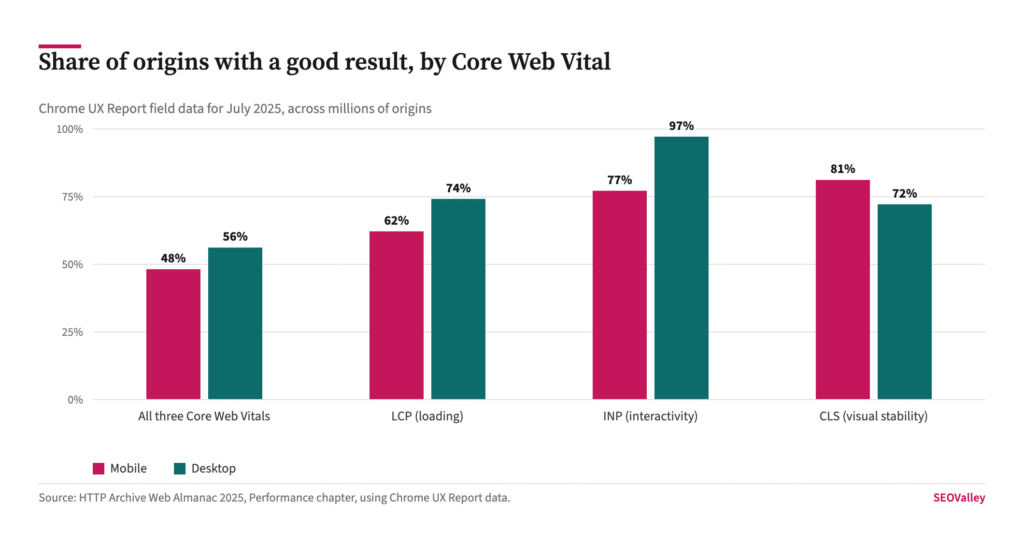
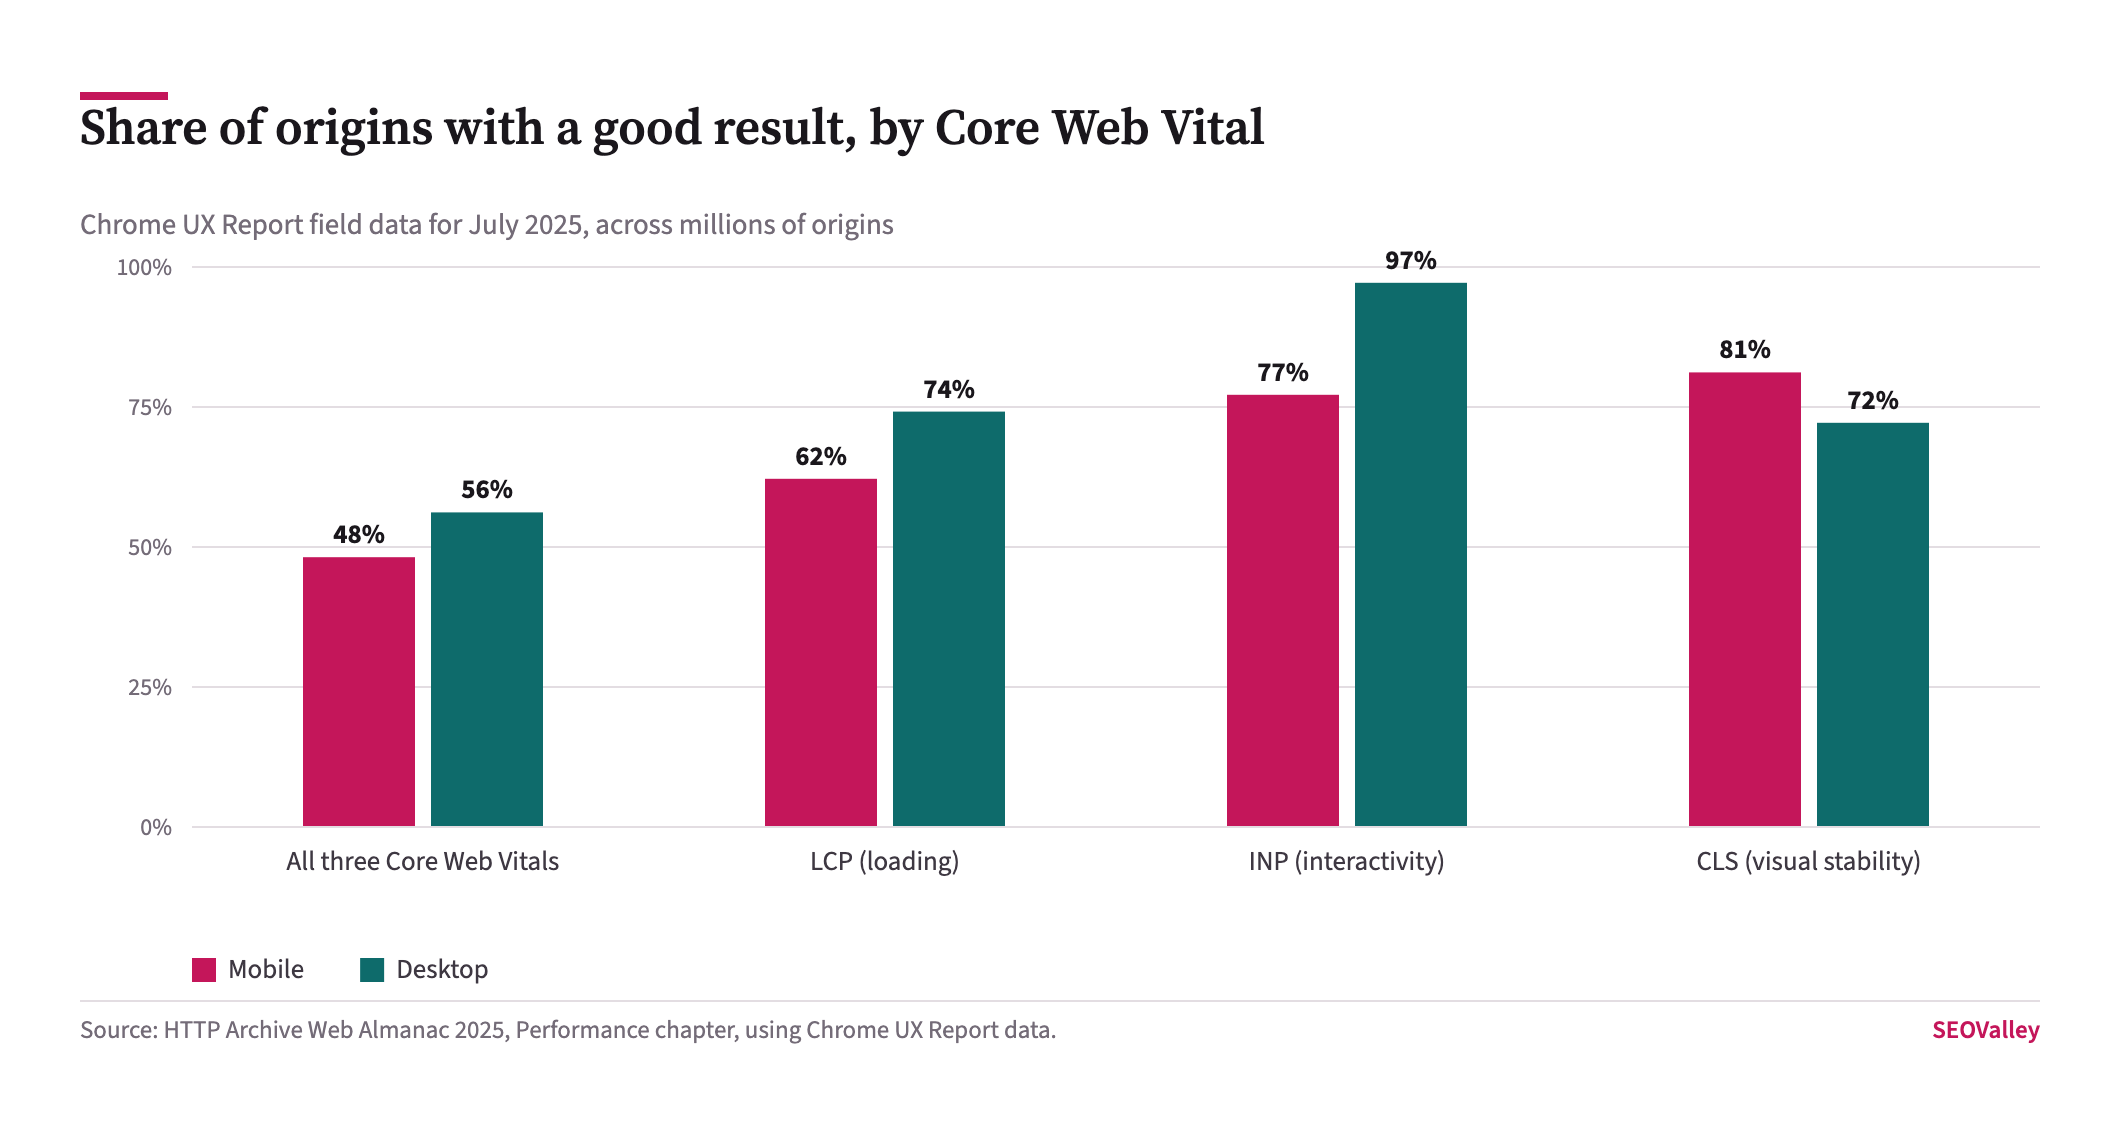
- Using Chrome UX Report data for July 2025, the HTTP Archive Web Almanac found 48% of mobile origins and 56% of desktop origins had good Core Web Vitals overall.
- In that same dataset, LCP was good on 62% of mobile origins while INP was good on 77% — so loading, not interactivity, is the metric most sites fail on mobile.
This article covers what changed when INP arrived, which metric is actually costing you a pass, what Google does and does not claim about ranking, and how to tell a real performance problem from a reporting artefact.
What actually changed when INP replaced FID?
The measurement got honest. First Input Delay recorded only the delay before the browser began processing your first interaction, which meant a page could score well while feeling unresponsive for the entire session.
What it looks like: a page that passed FID comfortably and still made users tap twice.
Key data: INP became a stable Core Web Vital in 2024 and measures the latency of interactions across the whole page visit, reporting close to the worst one rather than only the first.
Why it matters: sites that had optimised for FID discovered they had optimised for a metric that barely described the experience. The work did not transfer automatically.
The check: in PageSpeed Insights, read the field data section at the top rather than the lab score beneath it. Field data is what Search Console uses. If the origin has too little traffic to show field data, the report you are arguing about is lab-only and does not affect your Core Web Vitals assessment at all.
Which Core Web Vital is your site most likely failing?
Largest Contentful Paint, on mobile, by some distance. This surprises teams who spent 2024 bracing for INP.
Key data: in the Web Almanac’s July 2025 figures, mobile LCP was good on 62% of origins, INP on 77% and CLS on 81%. On desktop, INP was good on 97%.
Why it matters: INP absorbed most of the industry’s attention and most of the budget, and it is the metric most sites already pass. Meanwhile the slowest part of the stack — what it takes to render the main image or heading on a phone — went comparatively unexamined.
The check: open the Core Web Vitals report in Search Console, choose Mobile, and read which metric is named in the failing URL groups. Then take one failing URL to PageSpeed Insights and read the LCP element it identifies. It is usually a hero image, a web font, or a render-blocking script — and usually the same one across hundreds of URLs.
What are the thresholds, exactly?
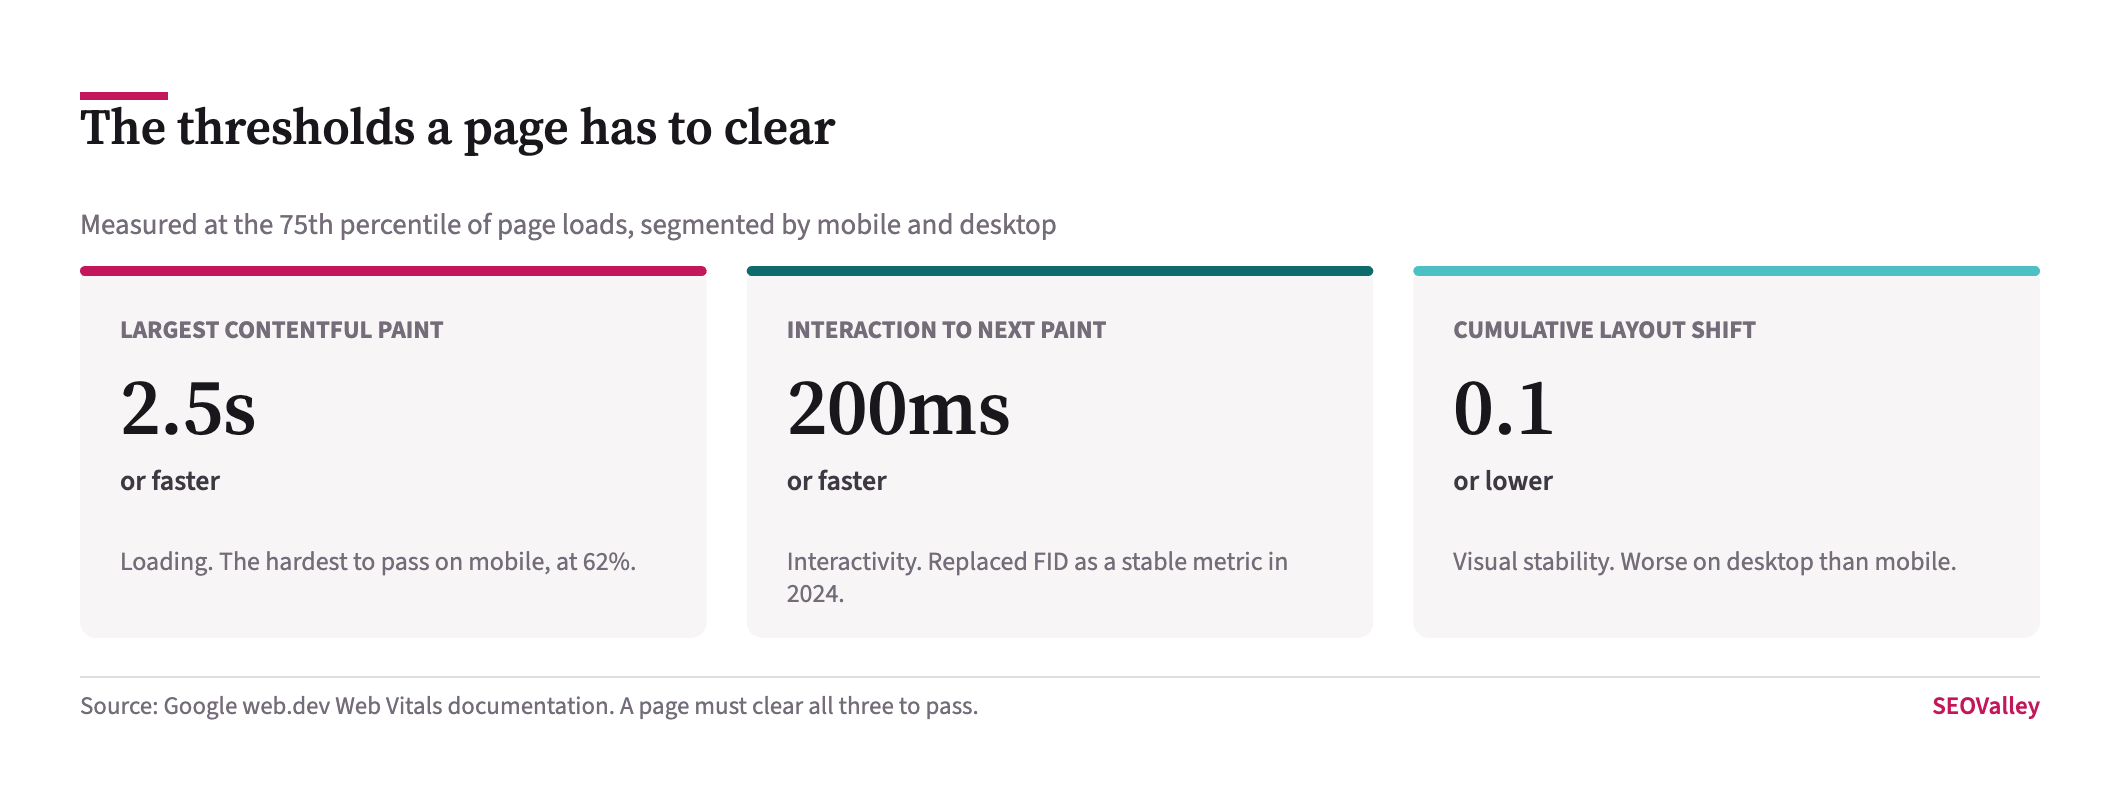
The percentile matters more than most teams realise. You are judged at the 75th percentile, which means a quarter of your visits can be worse than the threshold and you still pass.
Why it matters: averages will mislead you here. A median of 2.1 seconds tells you nothing about whether you pass, because the assessment ignores your median entirely.
There is a second consequence that catches teams out. Because mobile and desktop are assessed separately, a site can pass on desktop and fail on mobile indefinitely, and the mobile failure is the one that matters for most consumer traffic. Reporting a single blended figure hides exactly the half of the picture that needs work.
The check: whenever a developer reports a performance number, ask which percentile it is. If the answer is “average” or “our test machine”, it is not comparable to the thing Google measures.
Do Core Web Vitals affect rankings or not?
They contribute, and Google is careful never to promise more than that. Its page experience documentation says there is no single signal, and that core ranking systems look at a variety of signals aligned with overall page experience.
Key data: Google’s Core Web Vitals documentation states that good results in the Core Web Vitals report or third-party tools do not guarantee top rankings, and that there is more to page experience than Core Web Vitals scores alone.
Why it matters: this is the sentence to put in front of anyone promising a ranking recovery from a performance sprint. Google has pre-emptively declined to make that promise on its own behalf.
The realistic framing is a tie-breaker rather than a lever. Where two pages are comparably useful, experience can separate them; where your page is the less useful one, no amount of millisecond work will change the outcome. A site that has lost rankings almost always has a different cause worth diagnosing first.
Why did our scores improve but nothing happened?
Three common reasons, and only one of them is disappointing.
The change was measured in the lab rather than the field. Lab scores respond instantly to a code change; field data is a 28-day rolling window of real visits and lags by weeks.
The improvement did not cross a threshold. Moving LCP from 4.1 seconds to 3.2 seconds is real engineering progress and still a fail, because the assessment is a pass or a fail at 2.5 seconds rather than a sliding score.
Performance was never the constraint. If the pages rank where the content deserves, faster pages rank there faster.
The check: compare the same URL group in Search Console month on month rather than comparing PageSpeed Insights runs, and record the date you shipped each change. Without those dates you are reading noise.
Which fixes are worth the engineering time?
The ones that change what the browser does before it can paint the main content, since that is where most sites fail.
Serve the LCP image at the size it renders, in a modern format, without lazy-loading it. Lazy-loading the hero image is the single most common self-inflicted LCP failure, because the browser is told to defer the very thing it is being timed on.
Preload the font the heading uses, or accept a system font for that element. Reserve space for anything that loads late — images with explicit dimensions, ad slots with fixed heights — which is most of CLS solved.
Remove render-blocking scripts from the head, particularly third-party tags added by marketing without a performance review. Our technical SEO audit work finds these more often than genuine application bottlenecks.
Which fixes are theatre?
Chasing the Lighthouse score. It is a lab simulation on a throttled connection, it is not what Google assesses, and it moves when you rerun it without changing anything.
Shaving milliseconds off a metric you already pass. Taking desktop INP from 90ms to 70ms achieves nothing when the threshold is 200ms and 97% of desktop origins already clear it.
Rewriting the front end because the score is amber. The cost is enormous, the benefit is a pass on one of several signals, and the migration risk usually exceeds the gain — the same reasoning that applies to any redesign that puts existing rankings at risk.
Reporting a green Lighthouse score to a client as though it were a Core Web Vitals pass. These are different measurements and presenting one as the other is misleading, whether or not it is meant to be.
Does a redirect chain or a slow server count against you?
Server response time is not itself a Core Web Vital, but it sits underneath LCP and is frequently the reason LCP fails. If the browser waits 900 milliseconds for the first byte, the 2.5 second budget is already a third spent before anything renders.
What it looks like: LCP fails uniformly across every template, including pages with almost no content on them.
Why it matters: uniform failure points at infrastructure rather than at page design, and no amount of image optimisation will fix it. Teams often spend a sprint compressing assets on a site whose problem is an uncached database query or a redirect hop on every request.
The check: in PageSpeed Insights, read the Time to First Byte figure in the diagnostics. Then request a few URLs with curl and count the redirects — a http to https to www chain costs two extra round trips on every uncached visit, and it is usually fixable in one server configuration change rather than in application code.
How should performance work be reported?
As a pass rate on field data, by device, with the date of each change marked. Not as a score out of 100.
The check: build the report from the Search Console Core Web Vitals report — URL groups classed good, needs improvement and poor — and put the deployment dates on the same timeline. That answers whether your work moved real users, which the lab score never can.
Group the work by template rather than by URL. Core Web Vitals failures cluster by template because they are caused by shared components — the same hero image treatment, the same font loading strategy, the same tag manager container. Fixing one product template can move thousands of URLs from failing to passing in a single deployment, and a report organised by template makes that obvious in a way a list of URLs never does.
Say what the work is for. Faster pages reduce abandonment and improve conversion regardless of ranking, and that is a sufficient business case on its own. Promising a ranking gain Google has explicitly declined to promise sets up a conversation you will lose in three months.
Which performance work earns its time
| Action | Worth it? | Reason |
|---|---|---|
| Remove lazy-loading from the LCP image | Yes | The most common self-inflicted LCP failure, fixed in one line |
| Reserve dimensions for late-loading elements | Yes | Solves most of CLS without touching application logic |
| Remove render-blocking third-party tags | Yes | Marketing tags are added without a performance review |
| Chase a higher Lighthouse score | No | A lab simulation Google does not use for assessment |
| Optimise a metric you already pass | No | 97% of desktop origins already clear the INP threshold |
| Rewrite the front end because the report is amber | No | Migration risk usually exceeds the benefit of one signal |
Symptom, cause and how to confirm it
| Symptom | Likely cause | How to confirm |
|---|---|---|
| Lighthouse is green, Search Console is amber | Lab score versus 28-day field data | Read the field data section at the top of PageSpeed Insights, not the lab score |
| Mobile fails, desktop passes | Almost always LCP on mobile | Search Console Core Web Vitals report, Mobile tab, read the named metric |
| Hero image is the LCP element and it is slow | Lazy-loading applied to the LCP image | Check the hero img tag for loading=”lazy” and remove it |
| Metric improved but URL group still failing | Improvement did not cross the threshold | Compare the value against 2.5s, 200ms or 0.1 rather than against last month |
| Layout jumps on first load | Elements without reserved dimensions | Identify the shifting element in the PageSpeed Insights CLS diagnostic |
| No field data shown at all | Insufficient traffic for the Chrome UX Report | If the origin has no field data, Core Web Vitals are not assessed for it |
What to fix first, and what to leave alone
Core Web Vitals are worth passing and are not a ranking lever. Google says there is no single page experience signal and that a good report does not guarantee top rankings, and the field data says less than half of mobile origins pass anyway — so a pass is a differentiator on user experience rather than a shortcut in the results.
The single next action is to open the Core Web Vitals report in Search Console, switch to Mobile, and write down which metric names the largest failing URL group. On the balance of the field data it will be LCP, and the fix will be one template rather than a rebuild.
What not to do: do not commission a front-end rewrite on the strength of an amber report, do not optimise a metric you already pass, and do not report Lighthouse scores as Core Web Vitals results. If performance is genuinely the constraint, fix the LCP element on the highest-traffic template and measure again in a month — and if rankings are the real worry, diagnose the traffic drop properly before assuming speed caused it. Our audit and content teams work from field data and deployment dates rather than from a score out of 100.
About the author
Shabir MS leads SEOValley Solutions and has worked in search since 2005. He has run performance programmes through the page experience update, the arrival of INP and the retirement of FID, and has watched more than one green Lighthouse score fail to survive contact with field data. Read more from Shabir MS.
Frequently asked questions
What are the current Core Web Vitals thresholds?
Largest Contentful Paint at 2.5 seconds or faster, Interaction to Next Paint at 200 milliseconds or faster, and Cumulative Layout Shift at 0.1 or lower, per Google’s web.dev documentation.
When did INP replace FID?
Interaction to Next Paint became a stable Core Web Vital in 2024, replacing First Input Delay, which measured only the delay before the first interaction was processed.
Are Core Web Vitals a ranking factor?
They contribute to page experience, which core ranking systems consider. Google states there is no single page experience signal and that good scores do not guarantee top rankings.
How many websites pass Core Web Vitals?
Using July 2025 Chrome UX Report data, the Web Almanac found 48% of mobile origins and 56% of desktop origins had good Core Web Vitals across all three metrics.
Which Core Web Vital do most sites fail?
LCP on mobile. It was good on 62% of mobile origins, against 77% for INP and 81% for CLS in the same dataset.
What percentile are Core Web Vitals measured at?
The 75th percentile of page loads, assessed separately for mobile and desktop. A quarter of visits can exceed the threshold and the page still passes.
Why does Lighthouse disagree with Search Console?
Lighthouse is a lab simulation run on demand. Search Console uses a 28-day rolling window of real Chrome user data, so it lags code changes by weeks.
Why did my score improve but the URL group still fails?
The assessment is pass or fail at a fixed threshold. Moving LCP from 4.1 to 3.2 seconds is progress and still a failure against the 2.5 second bar.
What is the most common LCP mistake?
Lazy-loading the hero image. The browser defers the very element it is being timed on, which reliably pushes Largest Contentful Paint past the threshold.
How do I fix Cumulative Layout Shift?
Reserve space for anything that loads late. Set explicit width and height on images, give ad slots fixed heights, and avoid injecting banners above existing content.
My site shows no field data. What does that mean?
The origin has too little Chrome traffic for the Chrome UX Report. Without field data, Core Web Vitals are not assessed for those URLs.
Should I rebuild the front end to pass?
Rarely. The cost and migration risk usually exceed the benefit of passing one of several signals. Fix the LCP element on the highest-traffic template first.