Traffic is down by a third since spring. Nobody touched the site. Your rankings look exactly the same as they did in March, and every tool you own says you’re fine.
This is the most common support request in search right now, and it has more than one cause. Guess wrong and you’ll spend a quarter rewriting pages to fix something that was a broken tag all along.
First, our own numbers
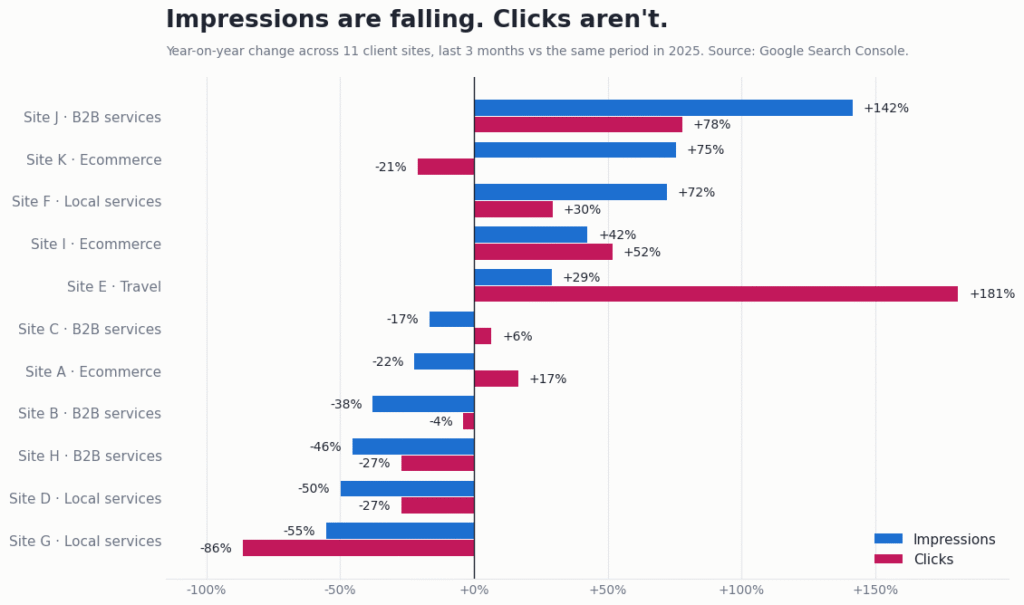
We pulled Google Search Console for 11 client properties in September 2026 and compared the last three months against the same period a year earlier. Between them they went from 3.78 million impressions to 2.70 million — a fall of 28.7%. Their combined clicks went from 40,174 to 40,207.
That is a million impressions gone and, to within a tenth of a percent, the same number of visits. Nine of the 11 improved their average position. Seven improved their click-through rate. One site in the set is a genuine casualty, and its problem turned out not to be AI at all.
So if your impressions are sliding, that on its own is not evidence of a problem. What matters is which of these ten things is happening underneath, and the checks below tell them apart.
This is a ranked list of the ten reasons a website’s organic clicks fall while its rankings hold steady, each with the check that confirms or rules it out.
The ten are ordered by how often we find them in audits, most common first, and each one is included only where there’s a specific test in Search Console or GA4 that separates it from the other nine.
1. An AI Overview is answering the query above your result
What it looks like: your page still ranks where it always did, but Google’s AI summary sits above it and answers the question before anyone scrolls.
Key data: Pew Research Center found that people clicked a traditional search result on 8% of visits where an AI summary appeared, against 15% where it didn’t, and Ahrefs measured a 34.5% CTR decline for the page in position one once an AI Overview appeared above it, across 300,000 keywords.
Why it matters: nothing has gone wrong with your SEO, so every fix aimed at your SEO will fail.
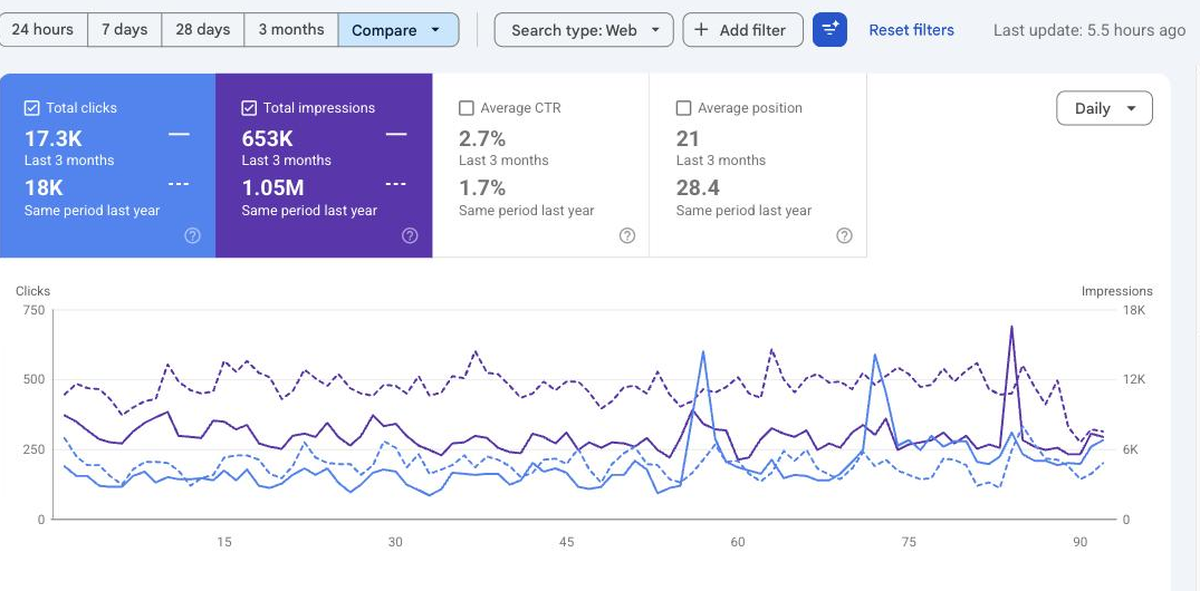
Here’s the check. In Search Console, open Performance → Search results, switch the date range to Compare, and put the last three months against the same period a year ago. Tick both Clicks and Impressions, then read the shape rather than the size. If Google is still showing your pages to the same number of people, your average position hasn’t moved, and fewer of those people are clicking, you’re looking at a SERP feature eating the click. AI Overviews are the most likely one in 2026, though a featured snippet, a People Also Ask block or a shopping carousel produces the same signature.
To confirm it, take your ten biggest losing queries and search them yourself, logged out, on mobile. You’ll know within a minute. It sounds crude next to a dashboard, but there’s still no Search Console dimension that tells you an AI Overview appeared, so looking remains the only direct evidence.
What to do about it is a longer conversation, and we’ll come back to it in the wrap-up. The short version: you won’t win back the click on a question that has a one-paragraph answer, so the work moves to getting cited inside the summary and to competing on the queries summaries handle badly.
2. Your traffic was mostly informational queries
What it looks like: your guides and how-to posts have collapsed while your service and product pages are untouched.
Key data: Semrush’s intent analysis put AI Overview coverage far higher on informational queries than on commercial ones at 18.57%, transactional at 13.94% and navigational at 10.33%.
Why it matters: if the decline is confined to top-of-funnel content, your revenue-generating pages are intact and the emergency is smaller than the traffic chart suggests.
Filter Queries in Search Console by the question words your audience actually uses — how, what, why, best way to — and compare that filtered set’s CTR against your brand and product queries over the same period. Two very different pictures usually emerge from one apparently uniform decline.
This split changes what you do next more than almost anything else on this list. A business whose informational CTR has halved while commercial CTR held steady doesn’t have a ranking problem; it has a content-mix problem, and the answer is to publish more of what AI summaries can’t replace — original data, pricing with real numbers in it, comparisons that depend on the reader’s situation — rather than more of what they can.
It also changes your reporting. If you present one blended traffic number to a client or a board, a healthy commercial performance disappears inside an informational decline, and you end up defending work that’s actually going well.
3. Your best queries are long questions
What it looks like: the longer and more conversational the query, the worse the click-through rate has become.
Key data: in Semrush’s sample, queries of seven words or more triggered an AI Overview 46.4% of the time, against 9.5% for single-word queries.
Why it matters: the long-tail strategy that worked for a decade — build pages that answer very specific questions — is now the strategy most exposed to summarisation.
Sort your Search Console queries by word count (export to a spreadsheet and count spaces; it takes two minutes) and compare CTR for one to three word queries against seven-plus. If the gap is wide and recent, you’ve found a large share of your missing clicks.
This doesn’t mean long-tail content is dead. It means the long-tail page has to earn the click with something the summary can’t carry: a calculator, a downloadable template, a table of your own prices, a case study with figures, a tool. Pages that exist only to restate a fact are the ones being absorbed, and they were always the weakest pages in the plan.
It’s worth being honest about which of your pages are in that category. In most content audits we run, somewhere between a fifth and a third of posts are pure restatement, written to fill a keyword gap rather than to say anything. Those are also the pages that cost the most to maintain.
4. You’re in a category where AI answers are everywhere
What it looks like: your competitors are down too, and everyone in the sector is having the same conversation.
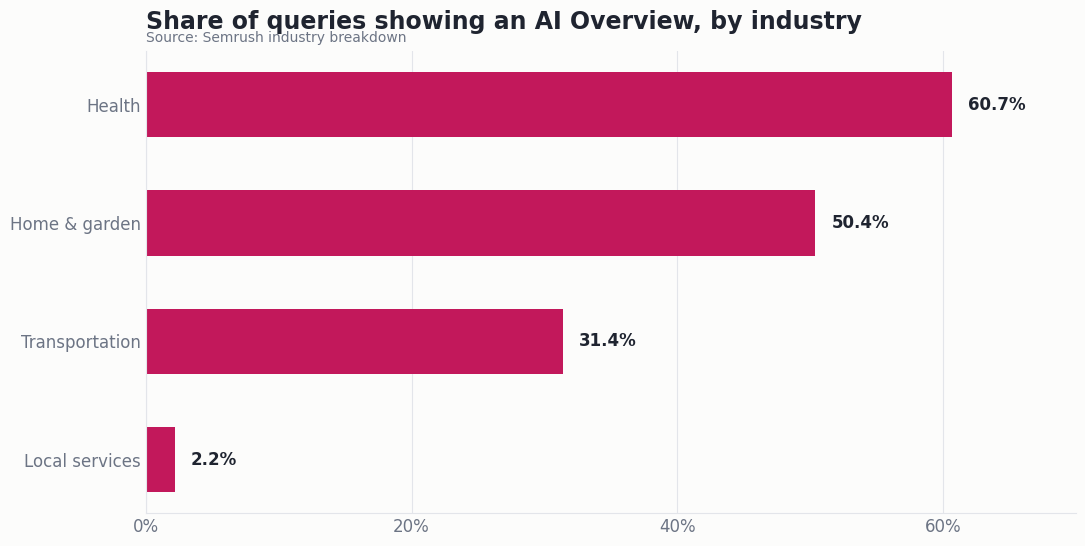
Key data: AI Overview prevalence varies enormously by sector — health at 60.7% and home and garden at 50.4% in Semrush’s industry breakdown, against local services at 2.2%.
Why it matters: in a high-coverage sector this is structural, not a competitive loss, and your strategy has to change rather than intensify.
Check where you sit before you panic or relax. A health, finance or DIY site is operating in a search environment where more than half of queries get answered on the results page. A plumber, an electrician or a removals firm is operating in one where almost none are — local intent still sends people to a map pack and a phone number, which is why local businesses have been largely insulated so far.
If you’re in a high-coverage category, the shift is toward channels and formats the summary doesn’t touch: email lists you own, communities, video, and the kind of proprietary data journalists and other sites cite. If you’re in a low-coverage one, you have time, and the best use of that time is to build those assets before coverage reaches you.
5. A featured snippet and an AI Overview are stacked above you
What it looks like: the queries where you used to own position zero are now your worst performers.
Key data: Amsive’s analysis of 700,000 keywords found a 37.04% CTR loss when an AI Overview coincided with a featured snippet — worse than either feature alone.
Why it matters: the pages hurt most are often your best pages, which makes this the hardest version of the problem to spot in aggregate reporting.
Pull the queries where you held a featured snippet a year ago and check them now. If the snippet is still yours but the clicks have gone, you’re looking at stacking: two answer boxes between the searcher and your result, each one reducing the chance anybody travels the distance.
There’s no clean fix, but there is a trade worth making. A snippet-optimised page that summarises its own answer in 40 words is easy to lift and easy to skip. The same page with the 40-word answer followed immediately by something only you have — your data, your pricing, your worked example — gives a reader a reason to continue that the summary can’t reproduce.
6. You were cited in the summary and still lost the click
What it looks like: you’re named as a source in the AI Overview, which feels like a win, and your clicks went down anyway.
Key data: Ahrefs measured a 64.4% CTR reduction for pages appearing within AI Overview content — a steeper fall than for pages merely ranking beneath one.
Why it matters: citation is a branding outcome, not a traffic outcome, and treating it as a traffic KPI will make your reporting look dishonest when the clicks don’t follow.
This is the finding that surprises clients most. Being quoted in the answer means the searcher got what they needed from you without visiting you. The citation still has value — it’s a recommendation in front of someone at the moment of decision — but it needs to be measured as visibility, not as sessions.
Track it deliberately: take your twenty priority questions, run them through ChatGPT, Gemini, Perplexity and Google’s AI Overviews once a month, and record whether you’re cited and what’s said about you. It takes half an hour and it’s the only version of rank tracking that reflects how a growing share of people now search. When a citation does send someone through, they tend to arrive further along: Adobe Analytics found AI-referred visitors converted 42% better than non-AI traffic in March 2026, with AI-referred retail traffic up 393% year on year in Q1 2026.
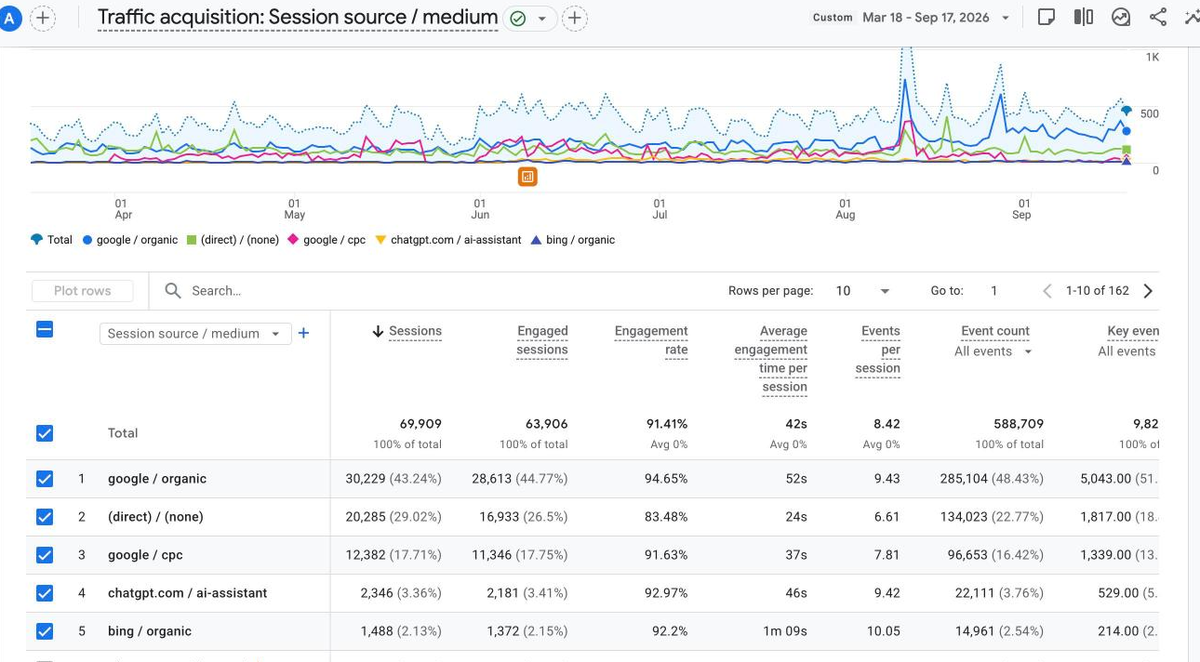
Our own client data points the same way. On one client site over the six months to September 2026, ChatGPT sources sent about 5% of all sessions but produced 8.5% of the conversions — a conversion rate of 11.4% against 8.4% for Google organic and 6.9% site-wide.
7. Seasonality, and you’re comparing the wrong months
What it looks like: a dramatic decline that turns out to be normal for the time of year.
Key data: not disclosed — this one is specific to your business, which is exactly why it gets missed.
Why it matters: a month-on-month comparison in a seasonal business manufactures a crisis every single year, and the work done in response gets credited with the recovery that was coming anyway.
Retailers, travel companies, home improvement firms, education providers and B2B services with a fiscal-year cycle all have months where demand halves. We work with a retailer whose quiet season runs May to September, when traffic drops by roughly half before recovering from late September. Compared with April, August looks catastrophic. Compared with the previous August, it’s flat.
Use year-on-year comparisons as your default in Search Console, and month-on-month only as a secondary view. If your business has a seasonal shape, put it in the report as a note so nobody reads a seasonal trough as a failure — and so your genuine gains don’t get swallowed when the season turns.
8. Average position is hiding a real ranking loss
What it looks like: your average position is unchanged, so you rule out a ranking problem — wrongly.
Key data: Ahrefs found a 27.04% CTR decline for keywords outside the top three positions, so movements within a stable average can still cost a lot of clicks.
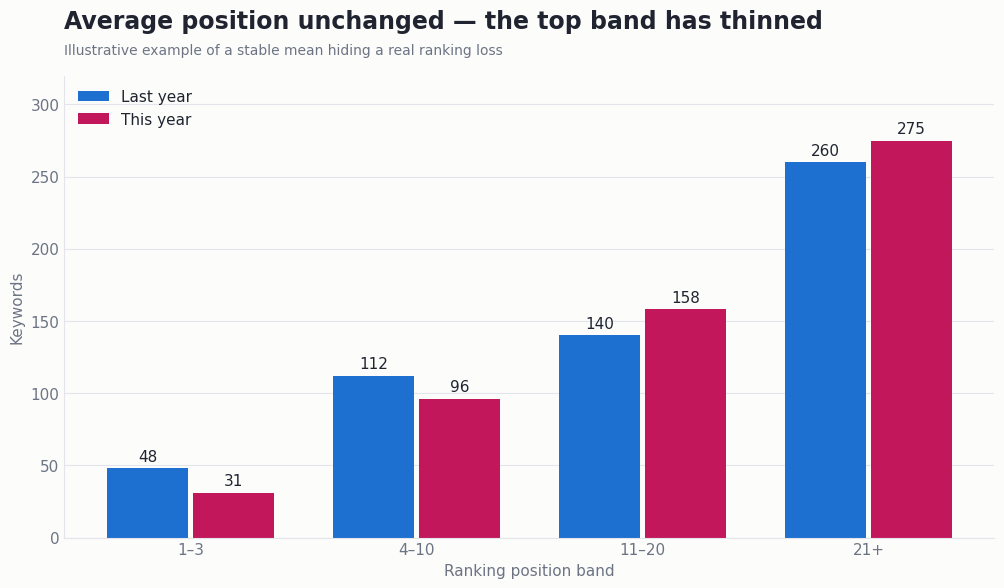
Why it matters: average position is a mean across every query and every impression, and a mean can sit perfectly still while the distribution underneath it changes completely.
Ten keywords moving from position 3 to position 8 and ten more moving from 15 to 10 produce no change in your average and a substantial loss of clicks, because the value of a position isn’t linear. Position 3 to 8 costs far more traffic than 15 to 10 gains.
Check position bands instead of the mean. Export your queries, bucket them into 1–3, 4–10, 11–20 and 21+, and compare the count in each band against the same export from a year ago. If the top band has thinned, you have a ranking problem regardless of what the headline number says — and that’s a different job, usually content quality or lost links, not a SERP feature.
9. Your tracking broke, not your traffic
What it looks like: a clean vertical drop on a specific date, often to exactly zero for one metric while others carry on.
Key data: not disclosed — but in our audits, tracking faults account for a meaningful minority of reported “traffic drops”, and they’re the cheapest of all these problems to fix.
Why it matters: you can spend months optimising for a decline that only ever existed in the measurement.
The usual suspects: a GA4 tag removed during a site update, a consent banner change that stopped firing analytics for most visitors, a conversion action whose thank-you page URL changed, a migration that left the old property collecting nothing, or an AI referral that GA4 reclassified between one release and the next.
Two checks settle it. First, compare Search Console clicks against GA4 organic sessions for the same period — Search Console is server-side and consent-independent, so if it shows clicks that GA4 doesn’t show as sessions, the fault is in your analytics rather than in search. Second, look at the shape of the drop. Search declines are gradients. Tracking failures are cliffs, and they usually start on a date someone can name, because somebody deployed something that day.
While you’re there, verify that your conversion goals still fire. We regularly find goal completions reading zero for months because a checkout or thank-you URL changed and nobody re-pointed the goal — which means the business has been flying blind on the only metric that actually matters.
10. Search itself is ending more often without a click
What it looks like: a slow, broad erosion across everything, with no single query or page to blame.
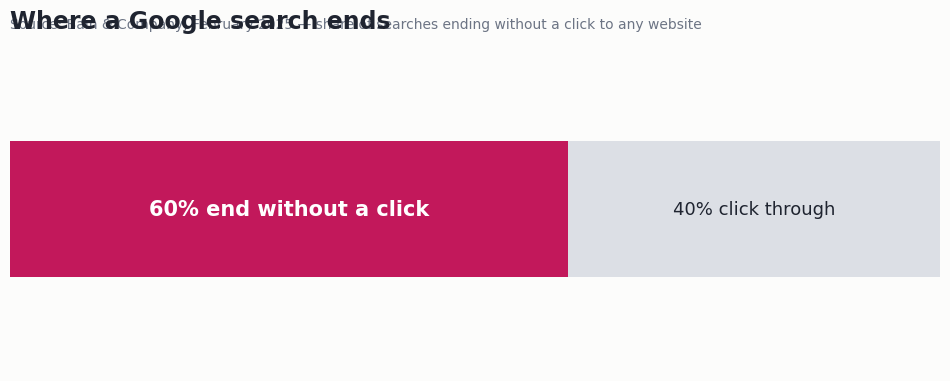
Key data: Bain & Company estimated in February 2025 that around 60% of searches end without a click to any website, and Pew found 26% of sessions ended entirely after a search with an AI summary, against 16% without one.
Why it matters: some of your lost clicks are not recoverable by anyone, at any budget, and a plan that assumes otherwise will keep missing its targets.
This is the hardest item to take to a board, and the most important one to say plainly. The share of searches that end on the results page has been rising for a decade, through featured snippets, knowledge panels, map packs and now AI answers. The direction has never reversed.
The strategic response is to stop treating search as the destination and start treating it as one of several places your business gets found. That means owned channels — email, communities, repeat customers — and presence in the places AI systems draw from. On that last point, the pattern in citation studies is consistent: Reddit, YouTube, LinkedIn and Wikipedia dominate the sources cited across major AI platforms, with Reddit ranking first or second on every one in Peec AI’s March 2026 analysis. Your visibility in those places is now part of your search visibility, whether or not it appears in any SEO tool you currently pay for.
Comparison table: matching the symptom to the cause
| Symptom | Clicks | Impressions | Average position | Most likely cause | Confirm it with |
|---|---|---|---|---|---|
| Steady erosion, informational pages worst | Down | Flat or up | Unchanged | AI Overview or other SERP feature (items 1–3) | Manual SERP check on top 10 losing queries |
| Whole sector affected | Down | Flat | Unchanged | High AI Overview coverage in your category (item 4) | Industry prevalence benchmark |
| Former position-zero pages worst hit | Down sharply | Flat | Unchanged | Snippet and AI Overview stacking (items 5–6) | Year-on-year snippet ownership check |
| Same months decline every year | Down | Down | Unchanged | Seasonality (item 7) | Year-on-year comparison in Search Console |
| Gradual decline, average position flat | Down | Down | Flat mean, shifted bands | Genuine ranking loss (item 8) | Position-band export, this year vs last |
| Vertical cliff on one date | Down to near zero | Unchanged in Search Console | Unchanged | Tracking or tagging fault (item 9) | Search Console clicks vs GA4 sessions |
What to do once you know which one it is
If it’s a tracking fault, fix it today; it’s the cheapest problem here and the fastest to recover from. If it’s a genuine ranking loss, audit the pages that fell against the ones that didn’t and look for what separates them — thin coverage, dated figures, no author, no first-hand evidence. If it’s seasonality, write the note in the report and carry on.
If it’s AI Overviews, and for most sites it will be at least partly that, there are two plays and neither is “write more blog posts”. The first is to get cited in the summary: clear headings that mirror the question, a direct answer in the first 40 words under each heading, original data nobody else has, structured data that tells the model what your page is, and consistent entity information across your site and the places that describe you. The second is to move your content plan toward what summaries handle badly — pricing with real numbers, comparisons, case studies, tools, anything where the answer depends on the reader’s specific circumstances.
And change the top line of your reporting. Sessions are now a misleading headline because the same number of qualified buyers can arrive inside a much smaller session count. Lead with qualified conversions from organic, impression share on target queries, AI citation appearances, and CTR split by query intent. That set tells you whether the business is winning even in a year when traffic charts slope downward.
If you’d like a second pair of eyes on which of the ten applies to your site, our free SEO audit runs this diagnostic on your own Search Console data, and our GEO service covers the citation work that follows.
Frequently asked questions
Why are my clicks falling while my rankings stay the same?
Almost always because something on the results page is answering the query before your result gets a chance — most often an AI Overview. Google still shows your page to the same number of people, which is why impressions hold, but fewer of them click through.
How do I know if AI Overviews are causing my traffic drop?
Look for flat impressions, falling clicks and an unchanged average position in Search Console, then search your ten biggest losing queries manually to see whether an AI Overview appears. Search Console has no AI Overview dimension, so the manual check is still the only direct confirmation.
How much do AI Overviews reduce click-through rate?
Ahrefs measured a 34.5% CTR decline for pages in position one when an AI Overview appeared above them, across 300,000 keywords. Pew Research Center found people clicked a result on 8% of visits with an AI summary versus 15% without.
What percentage of Google searches show an AI Overview?
Estimates vary by sample and by date: Semrush tracked around 15.7% of queries by late 2025, while an analysis of 108 million queries put the US figure near 20.5% in 2026. Prevalence is much higher on informational and long queries.
Which types of queries trigger AI Overviews most often?
Informational and long conversational queries. Queries of seven words or more triggered an AI Overview 46.4% of the time in Semrush’s sample, against 9.5% for single-word queries, while transactional queries sat at 13.94%.
Which industries are most affected by AI Overviews?
Health at 60.7% and home and garden at 50.4% were the highest in Semrush’s industry breakdown. Local services were the least affected at 2.2%, because local intent still resolves to a map pack.
Do I still get traffic if my page is cited in an AI Overview?
Some, but less than you’d expect. Ahrefs measured a 64.4% CTR reduction for pages appearing within AI Overview content, so citation is better understood as brand visibility than as a traffic channel.
What percentage of searches end without a click?
Bain & Company estimated around 60% in February 2025. Pew found that 26% of sessions ended entirely after a search that showed an AI summary, compared with 16% of sessions without one.
How do I check whether my drop is seasonal?
Compare the period against the same period last year in Search Console rather than against last month. If the shape repeats annually, it’s seasonality, and your year-on-year numbers will be roughly flat.
Can average position hide a ranking loss?
Yes. Average position is a mean, so keywords falling from position 3 to 8 and others rising from 15 to 10 can leave it unchanged while clicks fall. Compare counts by position band instead.
How can I tell a tracking problem from a real traffic drop?
Compare Search Console clicks with GA4 organic sessions for the same dates. Search Console is server-side and consent-independent, so clicks without matching sessions point to an analytics fault rather than a search one.
What does a tracking failure look like in the data?
A vertical cliff on a single date, often with one metric dropping to zero while others continue normally. Genuine search declines are gradients spread over weeks.
Is AI referral traffic worth anything?
Yes, disproportionately. Adobe Analytics found AI-referred visitors converted 42% better than non-AI traffic in March 2026, with AI-referred retail traffic up 393% year on year in Q1 2026, though absolute volumes remain small for most sites.
Which sources do AI assistants cite most?
Community and reference sites dominate. Peec AI’s March 2026 analysis found Reddit ranked first or second across all five major AI platforms, alongside YouTube, LinkedIn, Wikipedia, Forbes and G2.
How do I get cited in an AI Overview?
Answer the question directly in the first 40 words under a heading that mirrors how people ask it, publish data or examples nobody else has, and mark the page up with structured data so the model can identify what it is and who wrote it.
Should I stop publishing informational content?
No, but change what it contains. Pages that only restate a known fact are the ones being absorbed; pages carrying original data, pricing, comparisons or tools still earn the click.
How often should I check my AI visibility?
Monthly is enough for most businesses. Run your twenty priority questions through ChatGPT, Gemini, Perplexity and Google’s AI Overviews and record whether you’re cited and what’s said about you.
What metrics should replace sessions in my SEO report?
Qualified conversions from organic search, impression share on target queries, AI citation appearances, and click-through rate split by query intent. Together they show whether the business is winning even when session counts fall.
Do featured snippets make the AI Overview impact worse?
Yes. Amsive’s analysis of 700,000 keywords found a 37.04% CTR loss where an AI Overview coincided with a featured snippet, which is worse than either feature produces alone.
How long does it take to diagnose which cause applies to my site?
About 20 minutes for the Search Console and GA4 checks in this article, assuming you have 16 months of data. Confirming an AI Overview cause takes a few minutes more because the SERP check is manual.